Simulation experiments on single frequency signal spectrum detection method
This paper is a simulation experiment of the single-frequency signal spectrum detection method. The curves of the theoretical detection probability, statistical detection probability and CA-CFAR detection probability with signal-to-noise ratio are mainly compared.

It is worth noting that the CA-CFAR detection method has a high detection probability when detecting single-frequency signals. When the signal has a certain bandwidth, signal components will be introduced in the reference frequency, which will make the noise power estimate high and the detection probability of CA-CFAR detection method will deteriorate sharply. Only single-frequency signal detection is discussed here.
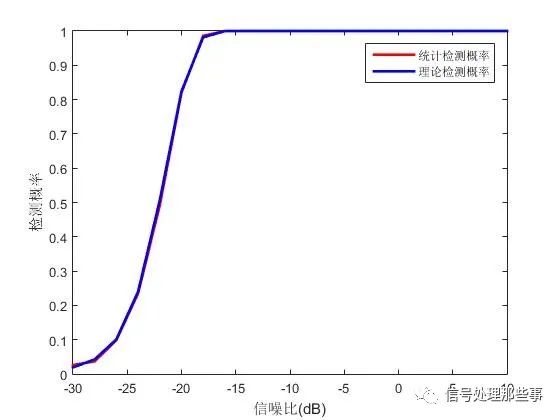
Experiment 1: The noise power is known to be 1, and the theoretical detection probability is compared with the statistical detection probability. 1024 FFT points, 1e-3 false alarm probability, and the signal-to-noise ratio varies from -30dB to 10dB.
The frequency of the single frequency signal is located at the 128th frequency point. Monte Carlo experiments were performed 1000 times. The variation curve of detection probability with S/N ratio is shown below. From the graph, it can be seen that the theoretical detection probability is very close to the statistical detection probability, which can verify the correctness of the derivation of the previous equation.
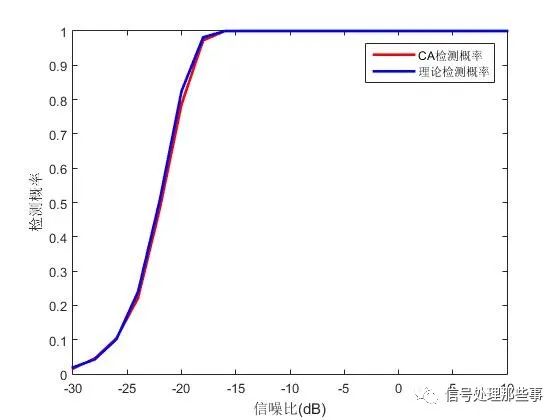
Experiment 2: The noise power is unknown, and CA-CFAR is used to estimate the noise power and compare the theoretical detection probability with the CA-CFAR detection probability. 1024 FFT points, 1e-3 false alarm probability, and the signal-to-noise ratio varies from -30dB to 10dB. The frequency of the single-frequency signal is located at the 128th frequency point, and the number of reference frequency points is 16 and 64.
The Monte Carlo experiment was performed 1000 times. When the number of reference frequency points is 64, the curves of the theoretical detection probability and CA-CFAR detection probability with signal-to-noise ratio are shown in Fig. From the figure, it can be seen that the detection probability of CA-CFAR is very close to the theoretical detection probability when detecting single-frequency signals.
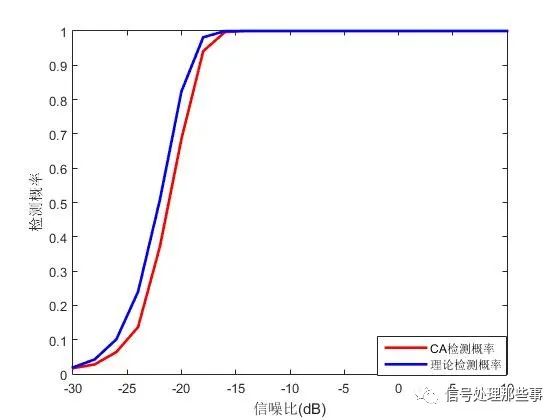
When the number of reference frequency points is 16, the curves of the theoretical detection probability and CA-CFAR detection probability with signal-to-noise ratio are shown in Fig. From the figure, it can be seen that the detection probability of CA-CFAR is slightly lower than the theoretical detection probability when single-frequency signals are detected.
It can be seen that the selection of the number of reference frequency points affects the detection probability of CA-CFAR. In the Gaussian white noise environment, when detecting a single single-frequency signal, increasing the number of reference frequency points can improve the detection probability, but no matter how to choose the number of reference frequency points, the detection probability of CA-CFAR will not exceed the theoretical detection probability.